1、操作系统优化:
/etc/sysctl.conf里增加:
vm.max_map_count=262144
/etc/security/limits.conf 增加:
* soft nofile 65536
* hard nofile 65536
* soft nproc 16384
* hard nproc 32768
/etc/security/limits.d/90-nproc.conf 修改如下:
* soft nproc 2048
root soft nproc unlimited
添加主机名/etc/hosts
10.1.14.39 test-20160224.novalocal
10.1.14.40 test-20160224-1.novalocal
10.1.14.41 test-20160224-2.novalocal
2、下载elasticsearch-5.5.3.tar.gz
Tar –zxvf elasticsearch-5.5.3.tar.gz
Mv elasticsearch-5.5.3 /home/htdocs/
需要用普通用户启动,新建webadmin用户。
chown -R webadin.webadmin /home/htdocs/elasticsearch-5.5.3
修改配置文件:
# ======================== Elasticsearch Configuration =========================
cluster.name: es-cluster
node.name: test-20160224.novalocal
#node.master: true
#node.data: true
path.data: /home/datas/es
path.logs: /home/logs/es
network.host: 10.1.14.39
http.port: 9200
transport.tcp.port: 9300
transport.tcp.compress: true
discovery.zen.ping.unicast.hosts: [“10.1.14.39:9300″,”10.1.14.40:9300″,”10.1.14.41:9300”]
discovery.zen.minimum_master_nodes: 1
#gateway.recover_after_nodes: 3
#action.destructive_requires_name: true
bootstrap.memory_lock: false
bootstrap.system_call_filter: false
http.cors.enabled: true
http.cors.allow-origin: “*”
http.cors.allow-headers: Authorization,Content-Type
script.engine.groovy.inline.search: on
script.engine.groovy.inline.aggs: on
#xpack.graph.enabled: false
#xpack.ml.enabled: false
#xpack.security.enabled: false
新建数据目录mkdir –p /home/datas/es /home/logs/es; chown –R webadmin.webadmin /home/logs/es /home/datas/es
Cd /home/htdocs/elasticsearch-5.5.3/bin
./ elasticsearch -d #启动
scp拷贝elasticsearch-5.5.3这个目录到10.1.14.40,101.14.41上,修改配置文件:
10.1.14.40 elasticsearch.yml
# ======================== Elasticsearch Configuration =========================
cluster.name: es-cluster
node.name: test-20160224-1.novalocal
#node.master: true
#node.data: true
path.data: /home/datas/es
path.logs: /home/logs/es
network.host: 10.1.14.40
http.port: 9200
transport.tcp.port: 9300
transport.tcp.compress: true
discovery.zen.ping.unicast.hosts: [“10.1.14.39:9300″,”10.1.14.40:9300″,”10.1.14.41:9300”]
discovery.zen.minimum_master_nodes: 1
#gateway.recover_after_nodes: 3
#action.destructive_requires_name: true
bootstrap.memory_lock: false
bootstrap.system_call_filter: false
http.cors.enabled: true
http.cors.allow-origin: “*”
http.cors.allow-headers: Authorization,Content-Type
script.engine.groovy.inline.search: on
script.engine.groovy.inline.aggs: on
#xpack.graph.enabled: false
#xpack.ml.enabled: false
#xpack.security.enabled: false
10.1.14.41 elasticsearch.yml
# ======================== Elasticsearch Configuration =========================
cluster.name: es-cluster
node.name: test-20160224-2.novalocal
#node.master: true
#node.data: true
path.data: /home/datas/es
path.logs: /home/logs/es
network.host: 10.1.14.41
http.port: 9200
transport.tcp.port: 9300
transport.tcp.compress: true
discovery.zen.ping.unicast.hosts: [“10.1.14.39:9300″,”10.1.14.40:9300″,”10.1.14.41:9300”]
discovery.zen.minimum_master_nodes: 1
#gateway.recover_after_nodes: 3
#action.destructive_requires_name: true
bootstrap.memory_lock: false
bootstrap.system_call_filter: false
http.cors.enabled: true
http.cors.allow-origin: “*”
http.cors.allow-headers: Authorization,Content-Type
script.engine.groovy.inline.search: on
script.engine.groovy.inline.aggs: on
#xpack.graph.enabled: false
#xpack.ml.enabled: false
#xpack.security.enabled: false
启动:
Cd /home/htdocs/elasticsearch-5.5.3/bin
./ elasticsearch -d
3、安装head监控插件
安装node.js
wget https://nodejs.org/dist/v6.10.2/node-v6.10.2-linux-x64.tar.xz
xz –d node-v6.10.2-linux-x64.tar.xz
tar xvf node-v6.10.2-linux-x64.tar
mv node-v6.10.2-linux-x64 /usr/local/node
vim /etc/profile #以下是所有添加的环境变量,包括了之前的jdk,红色是添加的内容
|
1 2 3 4 5 6 7 8 9 10 11 12 13 14 15 16 17 18 19 20 21 22 23 |
#java 1.8 JAVA_HOME=/usr/java/jdk1.8.0_131 CLASSPATH=.:$JAVA_HOME/lib.tools.jar PATH=$JAVA_HOME/bin:$PATH export JAVA_HOME CLASSPATH PATH #set maven MAVEN_HOME=/home/app/apache-maven-3.2.5 export MAVEN_HOME export PATH=${PATH}:${MAVEN_HOME}/bin ## export NODE_HOME=/usr/local/node export PATH=$PATH:$NODE_HOME/bin |
# node –v
# npm –v
安装head插件:
- git clone https://github.com/mobz/elasticsearch-head.git 或者git clone git://github.com/mobz/elasticsearch-head.git
chown –R webadmin.webadmin elasticsearch-head
npm install -g grunt
npm install -g grunt-cli
cd elasticsearch-head
npm install
vi elasticsearch-head/_site/app.js找到如下几行,红色是修改的内容:
|
1 2 3 4 |
init: function(parent) { this._super(); this.prefs = services.Preferences.instance(); this.base_uri = this.config.base_uri || this.prefs.get("app-base_uri") || "http://10.1.14.39:9200"; |
vi elasticsearch-head/Gruntfile.js增加如下,红色是增加内容:
|
1 2 3 4 5 6 7 |
connect: { server: { options: { hostname: "0.0.0.0", port: 9100, base: '.', keepalive: true |
重启后,启动:
grunt server &
bigdesk安装:
wget http://yellowcong.qiniudn.com/bigdesk-master.zip
解压,
然后配置nginx直到这个目录里直接访问即可:
|
1 2 3 4 5 6 7 8 9 10 11 12 13 14 15 |
server { listen 80; server_name 10.1.14.39; location / { root /home/htdocs/bigdesk; index index.html index.htm; } } |
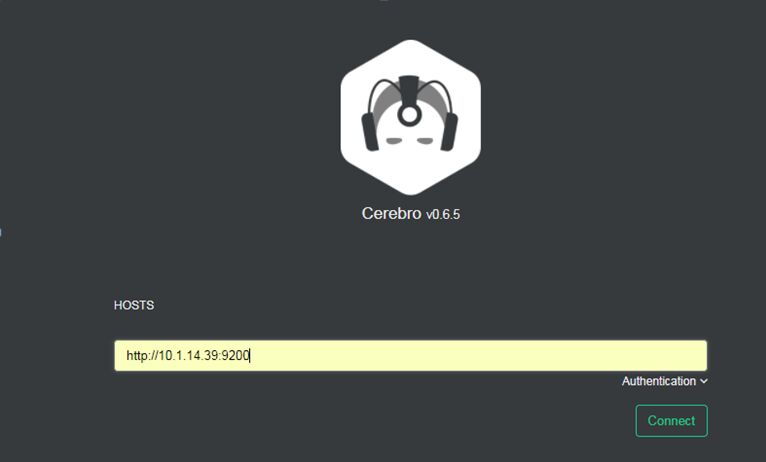
#cerebro 插件安装
wget https://github.com/lmenezes/cerebro/releases/download/v0.6.5/cerebro-0.6.5.tgz
tar zxvf cerebro-0.6.5.tgz
cd cerebro-0.6.5/
bin/cerebro
Zookeeper安装:
版本:zookeeper-3.4.10.tar.gz
也是这三台节点
解压 : tar –zxvf zookeeper-2.4.10.tar.gz
Mv zookeeper-3.4.10 /usr/local/zookeeper
编辑:/usr/local/zookeeper/conf/ zoo.cfg
|
1 2 3 4 5 6 7 8 9 10 11 12 13 14 15 16 17 18 19 20 21 22 23 24 25 26 27 28 29 30 31 32 33 |
# The number of milliseconds of each tick tickTime=2000 # The number of ticks that the initial # synchronization phase can take initLimit=10 # The number of ticks that can pass between # sending a request and getting an acknowledgement syncLimit=5 # the directory where the snapshot is stored. dataDir=/data/zk/zk0/data dataLogDir=/data/zk/zk0/logs # the port at which the clients will connect clientPort=2181 server.0 = 10.1.14.39:2888:3888 server.1 = 10.1.14.40:2888:3888 server.2 = 10.1.14.41:2888:3888 autopurge.purgeInterval=1 |
拷贝zookeeper目录到10.1.14.40, 10.1.14.41上。
分别在三台主机的dataDir路径下创建一个文件名为myid的文件,10.1.14.39, 10.1.14.40, 10.1.14.41 分别是:0,1,2
例如在10.1.14.39,
Cd /data/zk/zk0/data/
#Cat myid
0
在10.1.14.40上这个myid文件内容是1, 41上是2。
启动:
Cd /usr/local/zookeeper/
bin/zkServer.sh start
停止是:
bin/zkServer.sh stop
查看状态是:
bin/zkServer.sh status
注:Zookeeper默认会将控制台信息输出到启动路径下的zookeeper.out中,显然在生产环境中我们不能允许Zookeeper这样做,通过如下方法,可以让Zookeeper输出按尺寸切分的日志文件:
修改conf/log4j.properties文件,将zookeeper.root.logger=INFO, CONSOLE改为
zookeeper.root.logger=INFO, ROLLINGFILE修改bin/zkEnv.sh文件,将
ZOO_LOG4J_PROP=”INFO,CONSOLE”改为ZOO_LOG4J_PROP=”INFO,ROLLINGFILE”
然后重启zookeeper,就ok了
4、kafka安装,下载kafka_2.12-1.0.0.tgz,解压。
mv kafka_2.12-1.0.0 /usr/local/
进入config目录,编辑server.properties,内容如下:
|
1 2 3 4 5 6 7 8 9 10 11 12 13 14 15 16 17 18 19 20 21 22 23 24 25 26 27 28 29 30 31 32 33 34 35 |
broker.id=0 listeners=PLAINTEXT://10.1.14.39:9092 num.network.threads=3 num.io.threads=8 socket.send.buffer.bytes=102400 socket.receive.buffer.bytes=102400 socket.request.max.bytes=104857600 log.dirs=/tmp/kafka-logs num.partitions=1 num.recovery.threads.per.data.dir=1 offsets.topic.replication.factor=1 transaction.state.log.replication.factor=1 transaction.state.log.min.isr=1 log.retention.hours=168 log.segment.bytes=1073741824 log.retention.check.interval.ms=300000 zookeeper.connect=10.1.14.39:2181,10.1.14.40:2181,10.1.14.41:2181 zookeeper.connection.timeout.ms=6000 |
修改完毕后拷贝这个目录到其它2台上,编辑文件,只需修改broker.id
10.1.14.40 broker.id=1
10.1.14.41 broker.id=2
三台分别启动:
./kafka-server-start.sh ../config/server.properties &
创建topic,
|
1 |
bin/kafka-topics.sh --create --zookeeper 10.1.14.39:2181,10.1.14.40:2181,10.1.14.41:2181 --replication-factor 3 --partitions 1 --topic my-replicated-topic |
生产者:
bin/kafka-console-producer.sh –broker-list 10.1.14.39:9092,10.1.14.40:9092,10.1.14.41:9092 –topic my-replicated-topic
输入:
Hello kafka
消费者:
bin/kafka-console-consumer.sh –bootstrap-server 10.1.14.39:9092,10.1.14.40:9092,10.1.14.41:9092 –from-beginning –topic my-replicated-topic
会收到,hello kafka.
#创建nginx topic
./kafka-topics.sh –create –zookeeper 10.1.14.39:2181,10.1.14.40:2181,10.1.14.41:2181 –replication-factor 3 –partitions 3 –topic nginx-visitor-access-log
Filebeat安装:
curl -L -O https://artifacts.elastic.co/downloads/beats/filebeat/filebeat-5.1.1-x86_64.rpm
sudo rpm -vi filebeat-5.1.1-x86_64.rpm
#查看es中数据:
curl ‘10.1.14.39:9200/_cat/indices?v’
#配置filebeat
|
1 2 3 4 5 6 7 8 9 10 11 12 13 14 15 16 17 18 19 20 21 22 23 24 25 26 27 28 29 30 31 32 33 34 35 36 37 38 39 40 41 42 43 |
/etc/filebeat/filebeat.yml filebeat.prospectors: - type: log enabled: true paths: - /home/logs/nginx/*.acc.log ignore_older: 24h fields: log_topic: nginx-visitor-access-log filebeat.config.modules: path: ${path.config}/modules.d/*.yml reload.enabled: false setup.template.settings: index.number_of_shards: 3 setup.kibana: host: "10.1.14.41:5601" output.kafka: enable: true codec.format: string: '%{[message]}' hosts: ["10.1.14.39:9092","10.1.14.40:9092","10.1.14.41:9092"] topic: '%{[fields.log_topic]}' |
/etc/init.d/filebeat start # 启动
#logstash 安装:
官方下载logstash-6.1.2
解压
Mv logstash-6.1.2 /usr/local/
编写conf文件输出到es:
logstash_to_es.conf
|
1 2 3 4 5 6 7 8 9 10 11 12 13 14 15 16 17 18 19 20 21 22 23 24 25 26 27 28 29 30 31 32 33 34 35 36 37 38 39 40 41 42 43 44 45 46 47 48 49 50 51 |
input { kafka { bootstrap_servers => "10.1.14.39:9092,10.1.14.40:9092,10.1.14.41:9092" topics => ["nginx-visitor-access-log"] type => "nginx-visitor-access-log" } } filter { if [type] == "nginx-visitor-access-log"{ grok { match => { "message" => "%{IPORHOST:remote_addr} - - \[%{HTTPDATE:time_local}\] \"%{WORD:method} %{URIPATHPARAM:request} HTTP/%{NUMBER:httpversion}\" %{INT:status} %{INT:body_bytes_sent} %{QS:http_referer} %{QS:http_user_agent}" } } }else { grok { patterns_dir => ["./patterns"] } } } output { elasticsearch { hosts => ["10.1.14.39:9200", "10.1.14.40:9200","10.1.14.41:9200"] index => "nginx-visitor-access-log-%{+YYYY.MM.dd}" template_overwrite => true } } |
./logstash -f logstash_to_es.conf & # 启动Logstash
#配置nginx日志
log_format main ‘$remote_addr – $remote_user [$time_local] ‘
‘”$request” $status $body_bytes_sent ‘
‘”$http_referer” “$http_user_agent”‘;
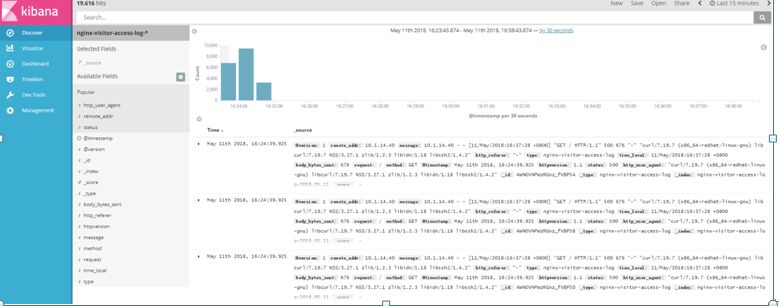
#配置Kibana
官网下载kibana-5.3.2-linux-x86_64
解析,进入config 目录:
配置:kibana.yml 修改如下:
server.port: 5601
server.host: “0.0.0.0”
elasticsearch.url: “http://10.1.14.39:9200”
kibana.index: “.kibana”
bin/kibana & #启动
#访问测试: